Mapping Marine Microplastics
Dec 3, 2021
About 8 million tons of plastic flow from rivers and beaches into the ocean every year. These plastics are carried by ocean currents and broken down by waves and sunlight into small microplastics. Much of that debris collects in the calm centers of ocean gyres in large floating garbage patches. The Great Pacific Garbage Patch, between California and Hawaii, is the most well-known because a lot of ship traffic passes through it.
Scientists typically estimate the amount plastic in marine garbage patches by dragging nets behind boats. However, this sampling method is geographically sparse and does not give researchers a sense of how much plastic concentrations change over time.
Researchers at the University of Michigan (UM) recently developed a new method to map the concentration of ocean microplastics around the world. The researchers used data from eight microsatellites that are part of the Cyclone Global Navigation Satellite System (CYGNSS) mission. Radio signals from GPS satellites reflect off the ocean surface, and CYGNSS satellites detect those reflections. Scientists then analyze the signals to measure the roughness of the ocean surface. These measurements provide scientists with a means to derive ocean wind speeds, which is useful for studying phenomena like hurricanes. It turns out that the signals also reveal the presence of plastic.
When there is plastic or other debris near the ocean surface, waves are dampened and the sea surface is less rough than it would be otherwise. “In cleaner waters, there’s a high degree of agreement between ocean roughness and wind speed,” said Chris Ruf, principal investigator of the CYGNSS mission and one of the authors of the research. “But as you head into the Great Pacific Garbage Patch, you see a bigger discrepancy between wind speed measurements and the roughness of the surface.”
Ruf and UM research assistant Madeline Evans compared CYGNSS roughness measurements to NOAA measurements of ocean wind speeds from buoys and other instruments to see where waters were less rough than expected. Combining those observations with previous modeling of ocean plastic, Ruf and Evans mapped concentrations of microplastics across the ocean for more than a year.
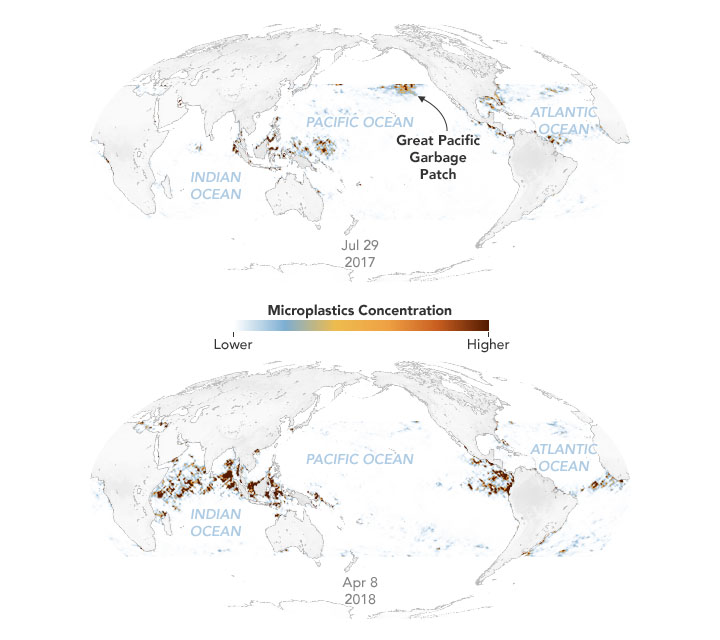
The animation and images on this page show the location and concentration of floating plastics between April 2017 to September 2018. Data were collected between approximately 38 degrees north and 38 degrees south latitude, the observation range for the CYGNSS mission. The microplastics dataset was recently published by NASA’s Physical Oceanography Distributed Active Archive Center (PO.DAAC).
Ruf and Evans are the first researchers to map ocean microplastics over such a large area and on a daily scale. Their data reveal some seasonal variations in microplastic concentrations. In the Great Pacific Garbage Patch, for example, microplastic concentrations appear greater in the summer and lower in winter, perhaps due to more vertical mixing of the ocean when the temperatures are cooler. Ruf and Evans also created time-lapse views of all of the major rivers in the world, noting particularly large amounts of microplastics coming from the Yangtze and Ganges.
NASA’s Interagency Implementation and Advanced Concepts Team (IMPACT) is also developing an innovative way of detecting ocean debris and plastics through machine learning. The research team used open-source computing tools and imagery from Planet Labs to train a model to automatically detect and label marine debris in high-resolution satellite imagery. The open-source code they developed—available on the IMPACT GitHub—could also be used to detect other phenomena on Earth such as buildings and roads.
NASA Earth Observatory images by Joshua Stevens, using data courtesy of Evans, M. C., & Ruf, C. S. (2021). Story by Emily Cassidy.